June 11, 2021 Market Update
GROWTH AND TECH STOCKS MAKE BIG JUMPS, BUT THE DJIA RETREATS AMIDST BIG INFLATION NUMBERS AND RISING OIL PRICES
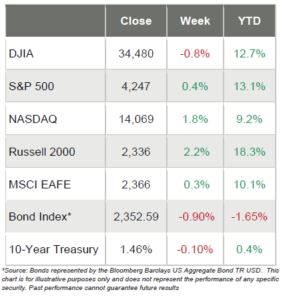
• Markets had a pretty good week, as the S&P 500 kept flirting with new all-time highs and the tech-laden NASDAQ and small-cap Russell 2000 made some big jumps
• When the week ended, the S&P 500 scratched out a meager 0.4% gain, while the Russell 2000 jumped 2.2% and NASDAQ leapt 1.8%
• The mega-cap, 30-stock DJIA on the other hand, gave back some gains and retreated 0.8% on the week
• Looking at the S&P 500 sectors, we saw quite a wide range, as the best performers were up more than 2% and the worst performers were down more than 2%
• The Real Estate sector (+2.0%) led the way, followed by Health Care (+1.9%), Consumer Discretionary (+1.6%) and Information Technology (+1.4%)
• Leading the laggards were Financials (-2.4%), Materials (-2.0%), and Industrials (-1.7%)
• The 10-year Treasury yield fell ten basis points to 1.46%
• WTI Crude Oil ended the week north of $70/barrel, which is just about double where it was this time last year
• Volatility was fairly even most of the week, before a brief spike on Thursday until it declined later that day and into Friday
In economic news, most of the headlines were focused on inflation numbers hitting 13-year highs, but Wall Street’s reaction was somewhat muted given assurances from the Federal Reserve that they would keep monetary policy highly accommodative for “some time” and that the recent jump in inflation would be temporary.
And Wall Street was pleased that Consumer Sentiment showed that the country is expecting prices to rise this year by about 4%, as overall sentiment jumped relative to May’s reporting. But the Consumer Sentiment data also contained a few nuggets of worry.
Consumer Sentiment Up, But There Are Some Worries
On Friday, the University of Michigan reported that Consumer Sentiment rose in early June, recouping two-thirds of May’s loss. From the release:
“The early June gain was mainly among middle and upper-income households and for future economic prospects rather than current conditions. Stronger growth in the national economy was anticipated, with an all-time record number of consumers anticipating a net decline in unemployment. Rising inflation remained a top concern of consumers, although the expected rate of inflation declined in early June.
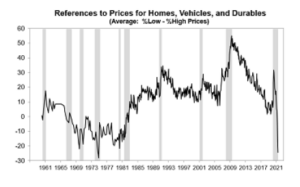
Spontaneous references to market prices for homes, vehicles, and household durables fell to their worst level since the all-time record in November 1974 (see the chart). These unfavorable perceptions of market prices reduced overall buying attitudes for vehicles and homes to their lowest point since 1982.
Labor Productivity Falls
On Thursday, the U.S. Bureau of Labor Statistics reported that labor productivity fell in 13 of 29 selected service-providing industries in 2020 (this is on the heels of labor productivity decreasing in 14 of 29 industries in 2019).
“The economic downturn in 2020 resulted in output declines in 21 industries and hours worked declines in 24 industries. More than twice as many industries experienced decreases in 2020 compared to 2019, when
output fell in 8 industries and hours worked fell in 10 industries.”
Further:
• Labor productivity fell in 13 of 29 industries in 2020.
• There were 3 industries where productivity fell more than 38 percent: Air transportation (-57.0 percent), travel arrangement and reservation services (-44.7 percent), and amusement parks and arcades (-38.5 percent).
• In all 3 of those industries, output fell more than 55 percent.
• Productivity increased in 5 industries where declines in hours worked exceeded the decrease in output. In all of those industries, output fell more than 10 percent.
• Hours worked fell in 24 of the 29 industries.
• Hours worked decreased in 14 out of the 16 industries which recorded increases in productivity.
Of these, the largest declines in hours worked were in gambling industries (-32.8 percent), drycleaning and laundry services (-19.5 percent), and line-haul railroads (-16.3 percent); the other 11 industries had hours worked declines of 11.7 percent or less
Goods and Services by Selected Countries (Quarterly)
Statistics on trade in goods and services by country and area are only available quarterly, with a one-month lag. With this release, first-quarter figures are now available.
The first-quarter figures show surpluses, in billions of dollars, with: South and Central America ($21.4), Hong Kong ($7.1), Brazil ($6.2), Singapore ($4.6), Saudi Arabia ($3.1), and United Kingdom ($3.1).
Deficits were recorded, in billions of dollars, with: China ($91.4), European Union ($44.1), Mexico ($27.9), Germany ($18.5), Japan ($14.5), India ($9.2), Italy ($9.0), Taiwan ($7.5), France ($6.5), Canada ($6.0), and South Korea ($3.6).
• The deficit with China increased $15.4 billion to $91.4 billion in the first quarter.
• The balance with Canada shifted from a surplus of $1.2 billion in the fourth quarter to a deficit of $6.0 billion in the first quarter.
• The deficit with Mexico decreased $7.3 billion to $27.9 billion in the first quarter.
Sources: bea.gov; bls.gov; umich.edu; msci.com; fidelity.com; nasdaq.com; wsj.com; morningstar.com
Weekly Market Update – June 11, 2021

The Growth Names Move Up as the Value Names Take a Breather
A 10 basis point decline in the 10-year Treasury fueled the growth names, as the S&P 500 kept teasing new record highs while the technology-stuffed NASDAQ and the smaller-cap Russell 2000 made some big gains.
Overall it was another light trading week, as it was during last week’s holiday-shortened trading time, but the tech names rallied again to mark their fourth consecutive weekly gain.

Spontaneous references to market prices for homes, vehicles, and household durables fell to their worst level since the all-time record in November 1974 (see the chart). These unfavorable perceptions of market prices reduced overall buying attitudes for vehicles and homes to their lowest point since 1982.
These declines were especially sharp among those with incomes in the top third, who account for more than half of the dollar volume of retail sales. Fortunately, in the emergence from the pandemic, consumers are temporarily less sensitive to prices due to pent-up demand and record savings as well as improved job and income prospects.
The acceptance of price increases as due to the pandemic, makes inflationary psychology more likely to gain a foothold if the exit is lengthy. While expansive monetary and fiscal policies are still warranted, the accompanying rise in inflation will cause uneven distributional impacts. Those impacts have already been noticed in June among the elderly and lower income households. A shift in the Fed’s policy language could douse any incipient inflationary psychology, it would be no surprise to consumers, as two-thirds already expect higher interest rates in the year ahead.”
Exports Up, Imports Down
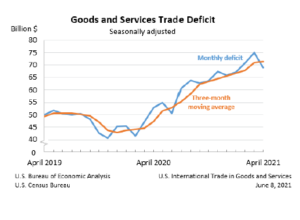
“On Tuesday, June 8th, the U.S. Department of Commerce reported that the goods and services deficit was $68.9 billion in April, down $6.1 billion from $75.0 billion in March.
• April exports were $205.0 billion, $2.3 billion more than March exports.
• April imports were $273.9 billion, $3.8 billion less than March imports.
The April decrease in the goods and services deficit reflected a decrease in the goods deficit of $6.2 billion to $86.7 billion and a decrease in the services surplus of $0.1 billion to $17.8 billion.

Year-to-date, the goods and services deficit increased $94.5 billion, or 50.5 percent, from the same period in 2020. Exports increased $42.0 billion or 5.6 percent. Imports increased $136.4 billion or 14.6 percent.
Disclosure: Emerald Advisors, LLC is a registered investment adviser. Information presented is for educational purposes only and does not intend to make an offer or solicitation for the sale or purchase of any specific securities, investments, or investment strategies. Investments involve risk and, unless otherwise stated, are not guaranteed. Be sure to first consult with a qualified financial adviser and/or tax professional before implementing any strategy discussed herein. Past performance is not indicative of future performance.


